
Tracking Task Completion
Learn to track task completion to report on success vs fail % of specific user tasks, highlight pain points and opportunities for improvement, identify user happy paths, create custom funnels, etc.
What is Task Completion?
Task completion is the rate at which users are able to reach a successful endpoint in a conversation. Examples can be: If a user was able to confirm an appointment, make a purchase or reach the help documentation needed.
We can track task completion by creating KPI's, flows, happy paths and funnels that are important to reporting requirements. Then after creating these metrics on cards within the dashbot database, we can create a full picture dashboard telling your users' task completion story.
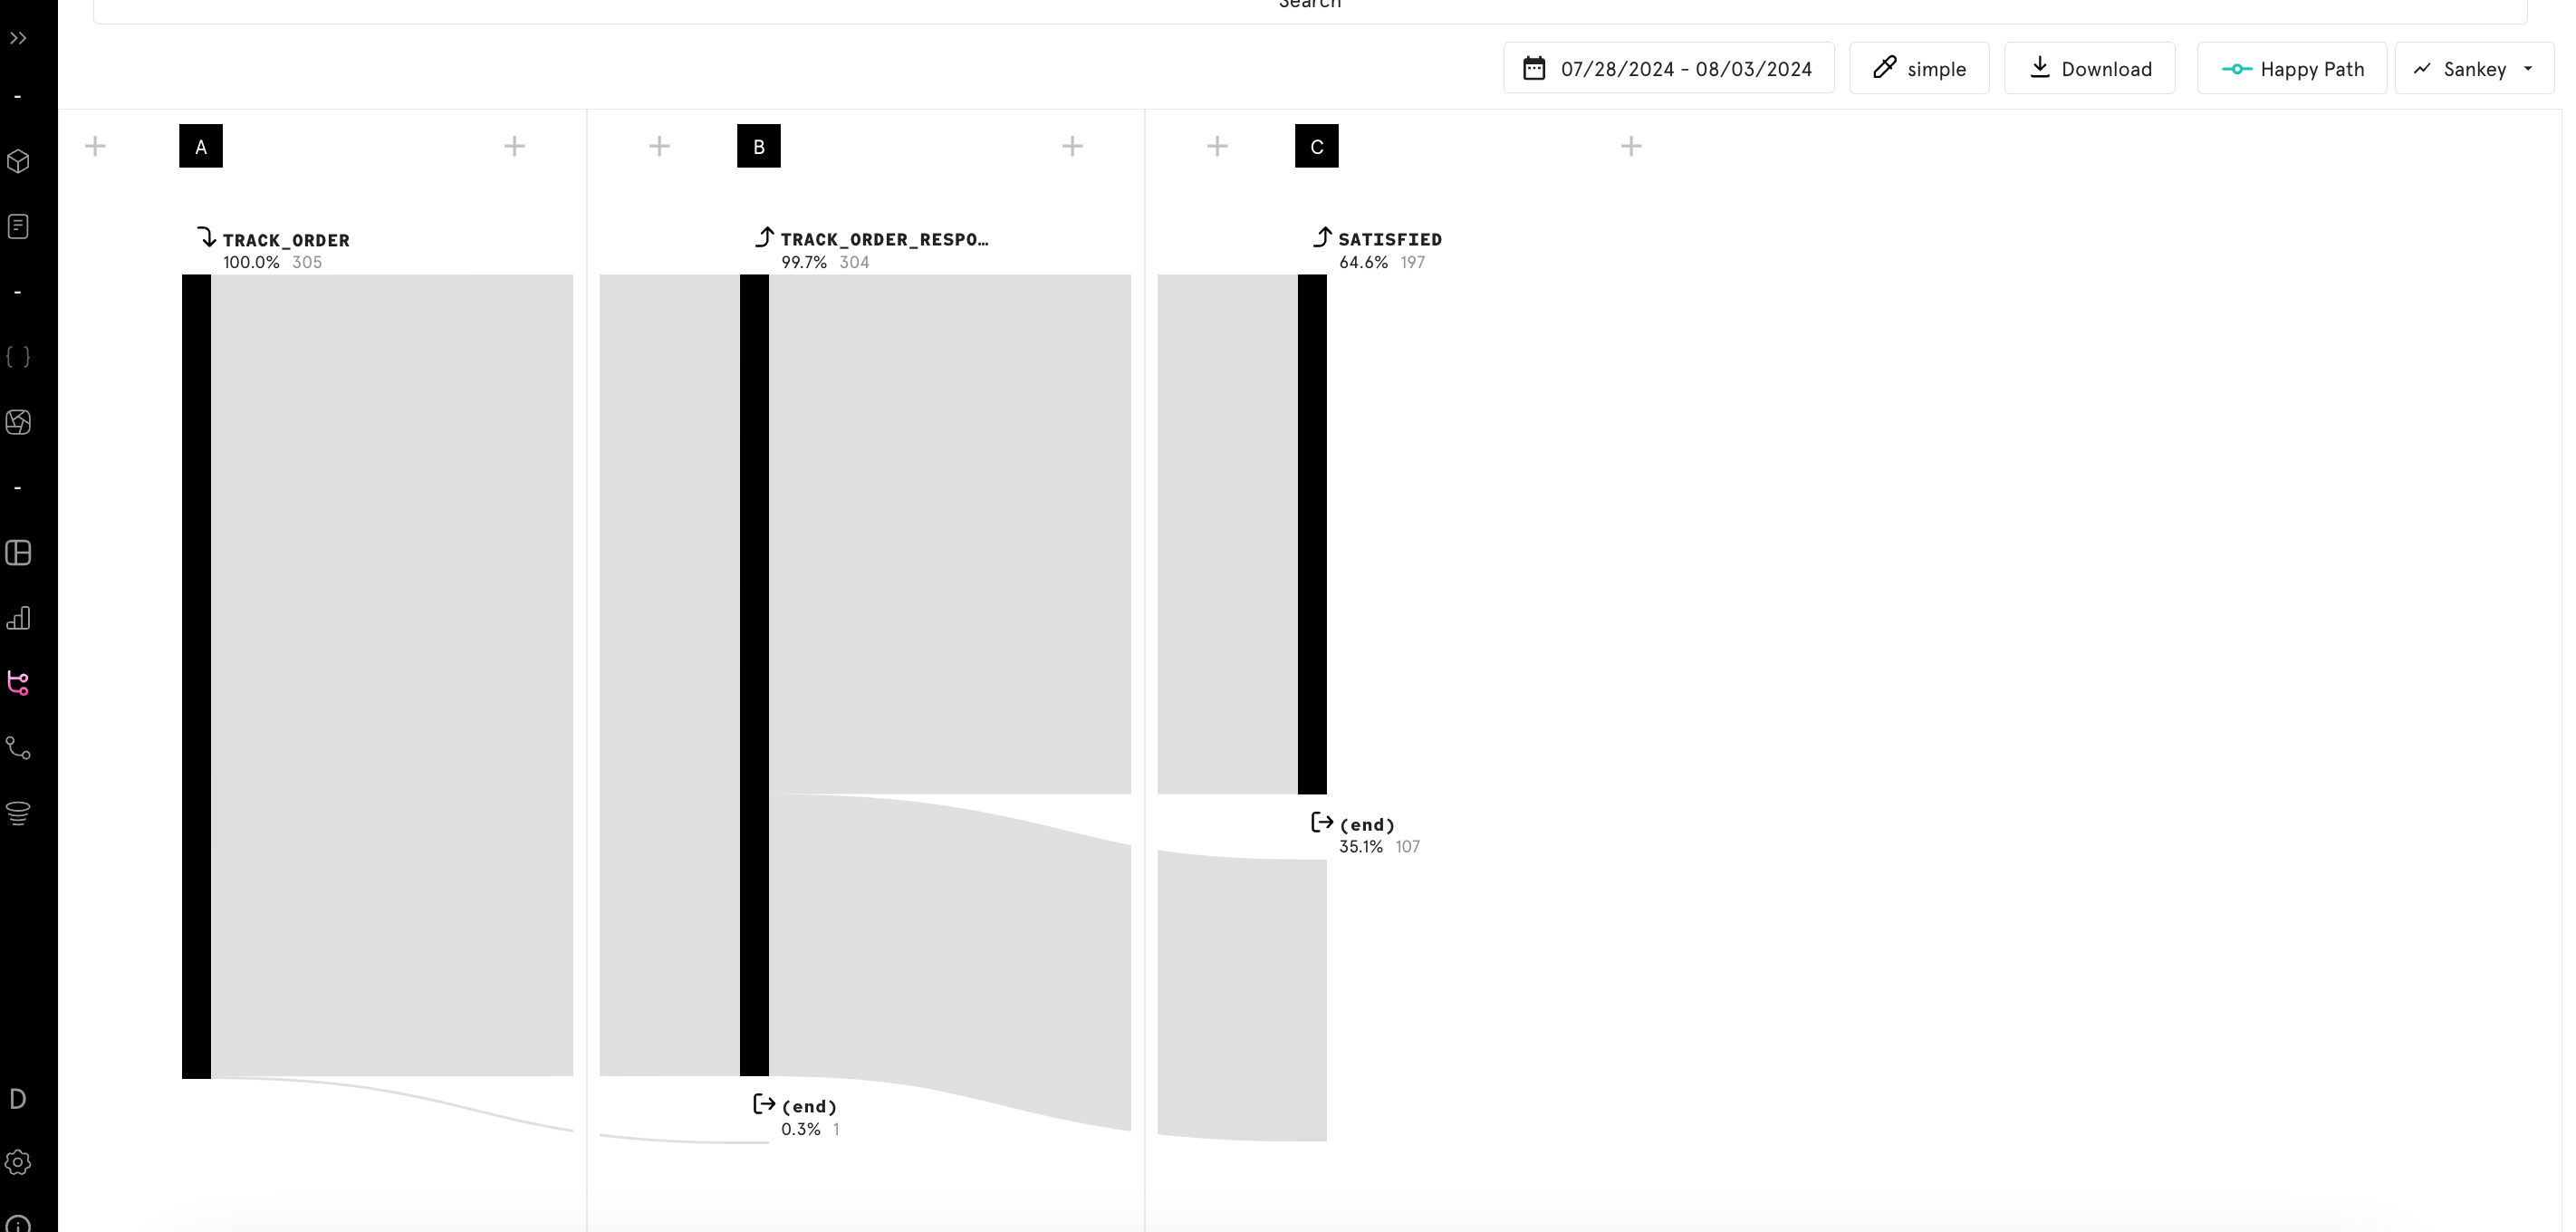
Now that we've defined our success criteria, we can begin to build out a flow to track task completion and the success rate. Flows allow us to to see the user journey and track task completion rates.
We'll create a flow to measure the success rate of task completion. We'll use "Satisfied" as an example criteria.
Setting Up A Flow To Track User Journeys
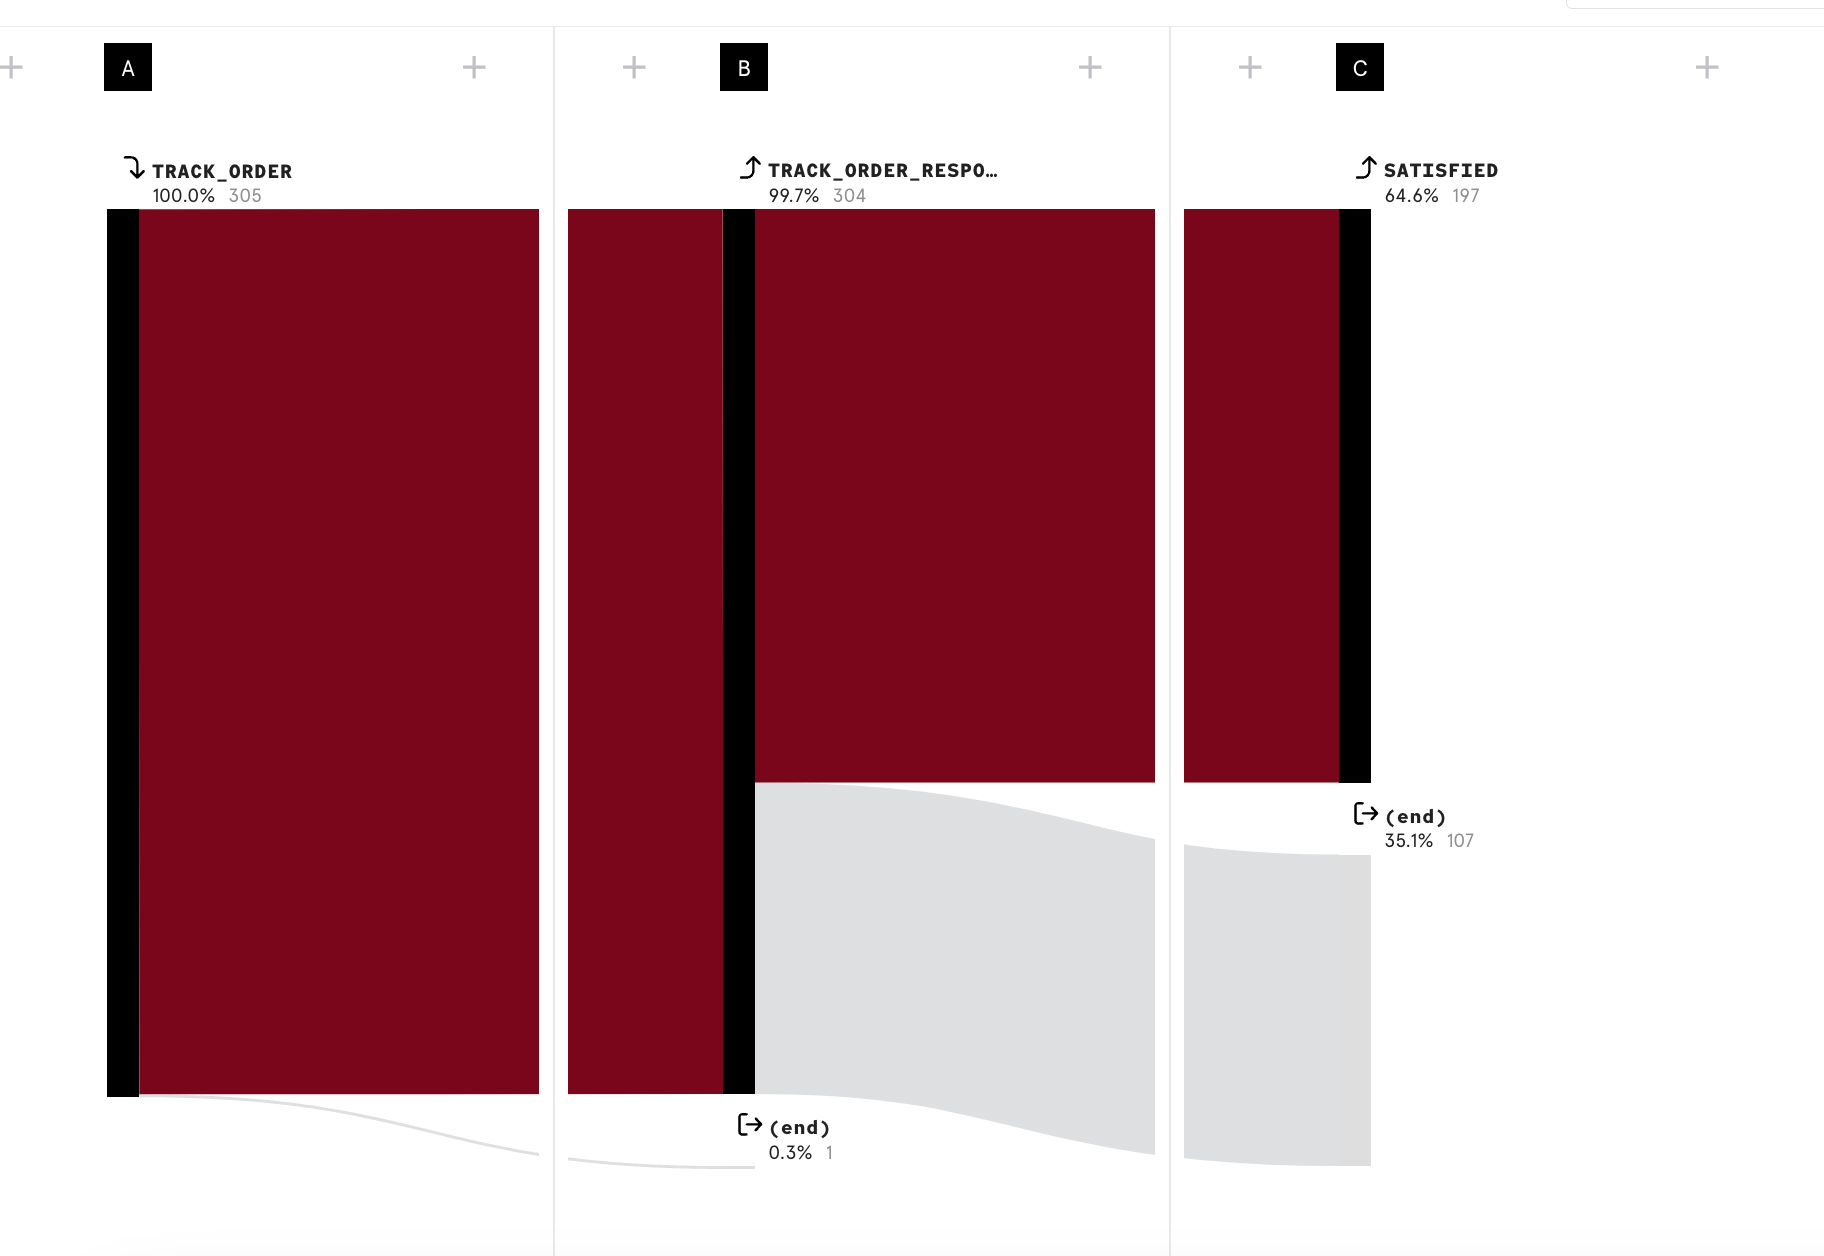
Specify a Happy Path
To better visualize our task completion %, we'll create a happy path. A happy path is a color designation of a specific user journey that allows dashbot users to distinguish an important user journey.
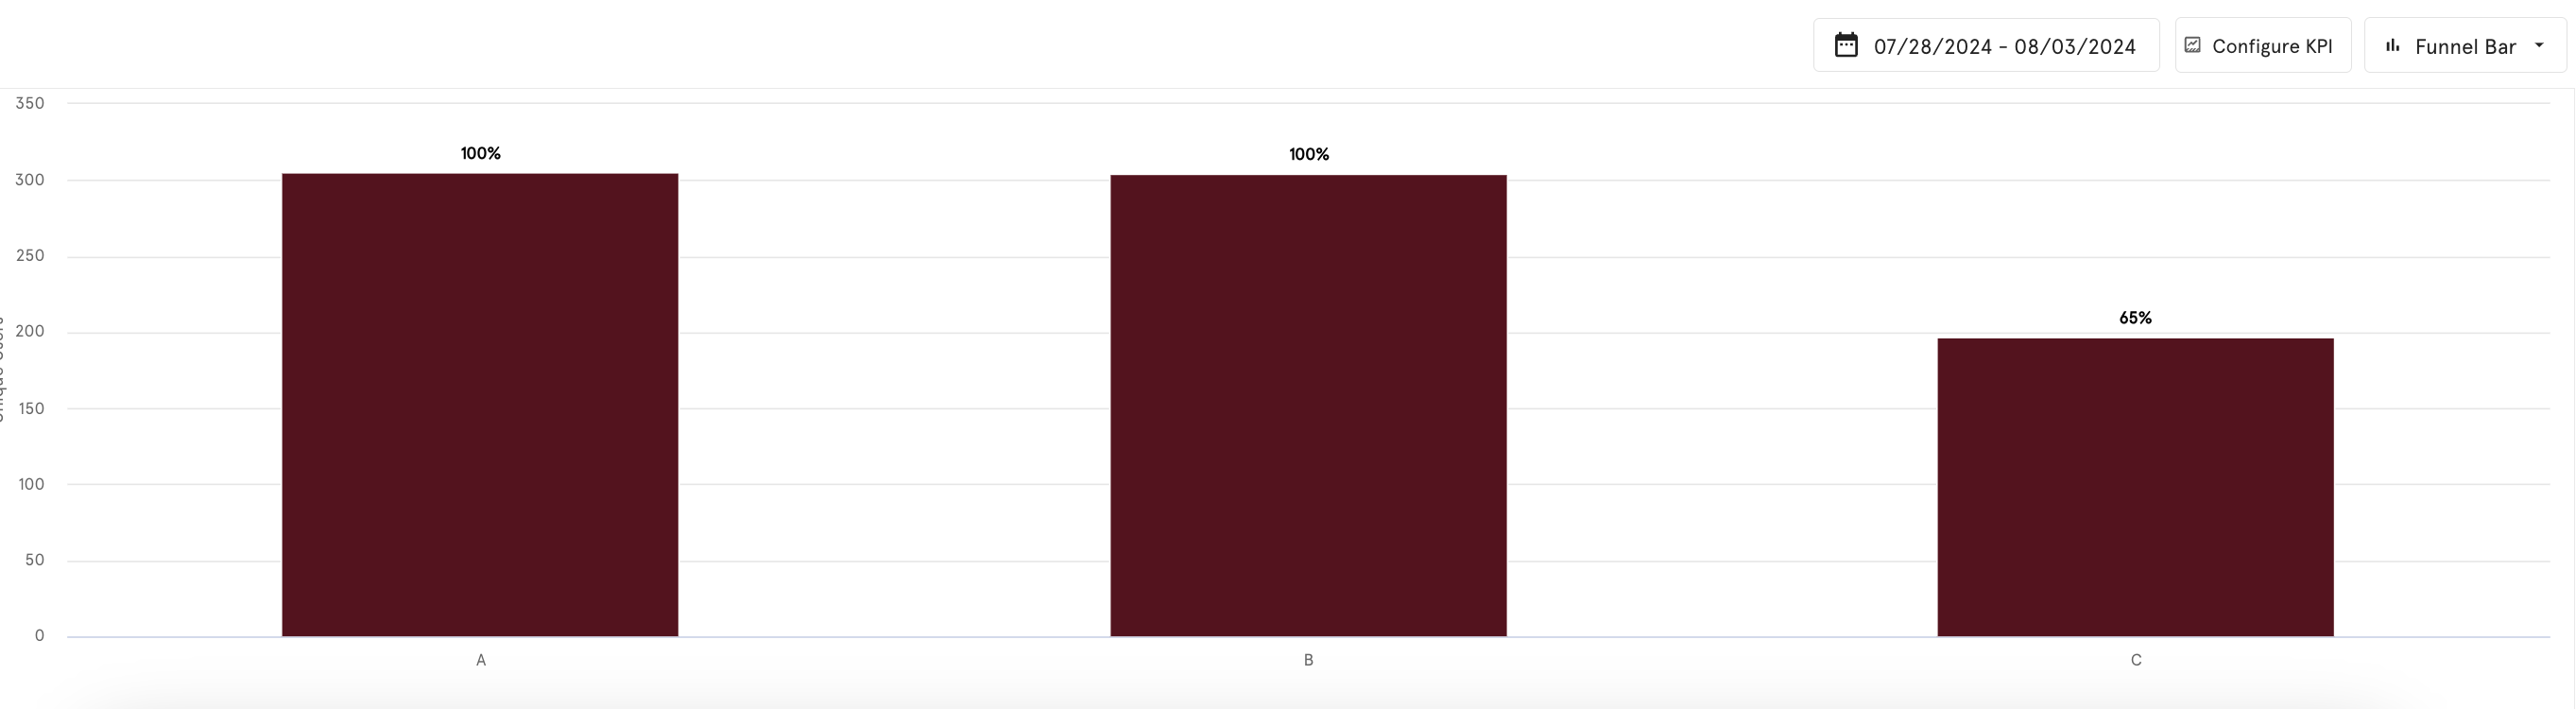
Create a Funnel
Learn how to set up a funnel visualization to track user progress through different stages of the user journey.
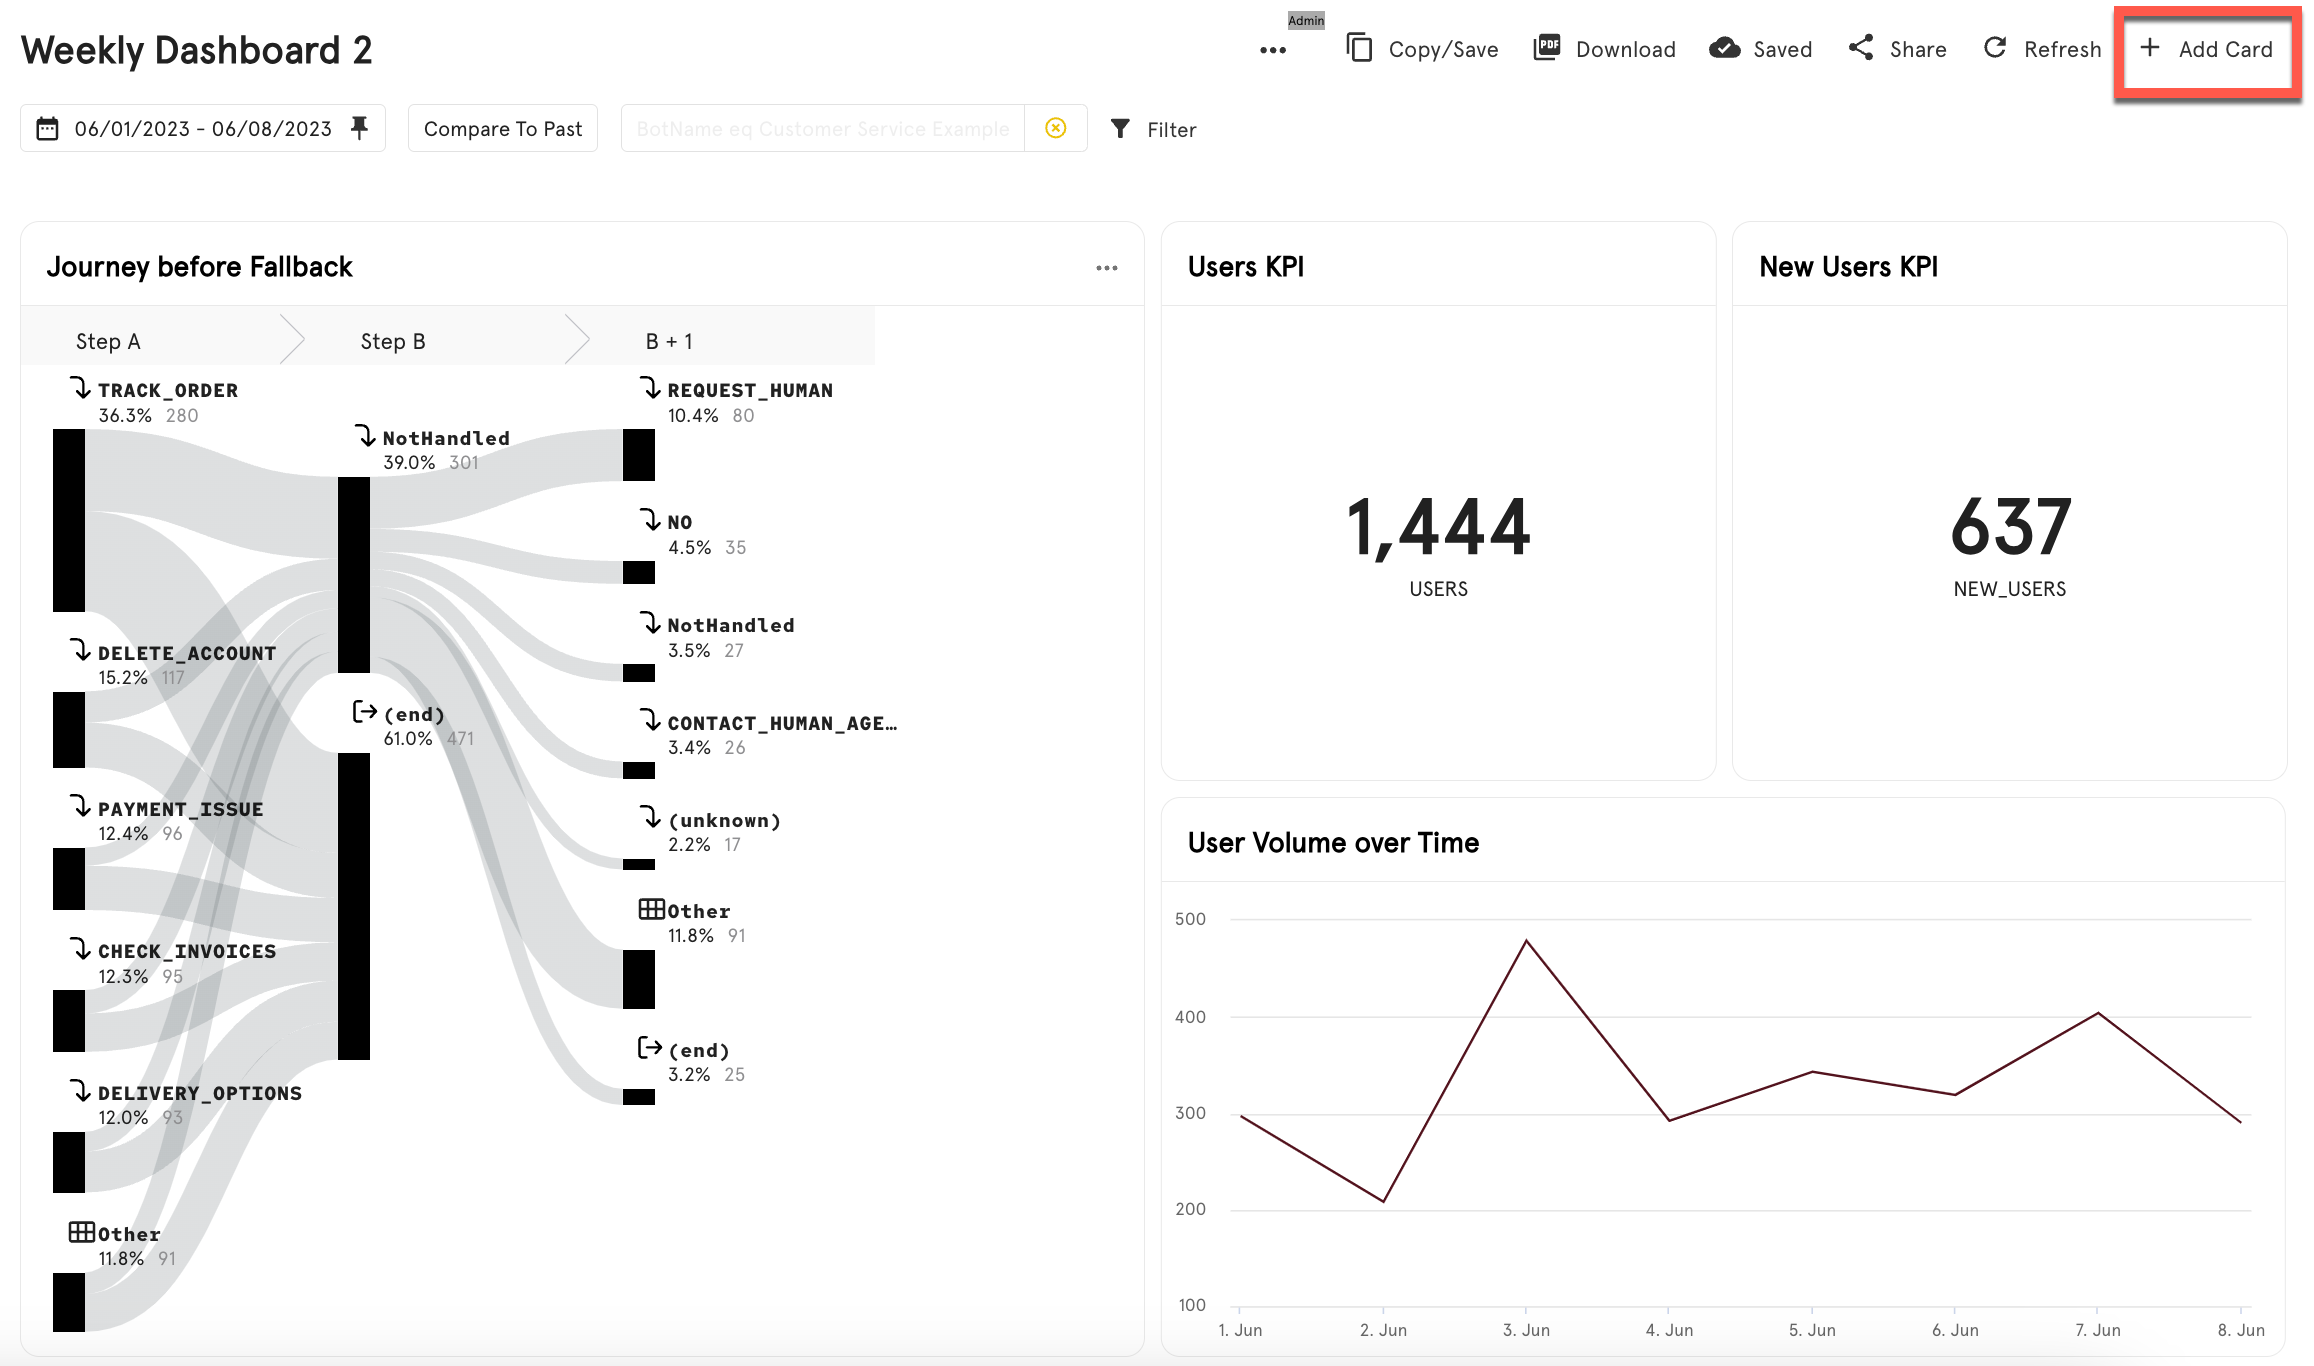
Add your card to a dashboard
Finally, we'll add these cards to a dashboard to tell the full story of how users are completing journeys.
Updated 29 days ago