
Data Slicer Configuration
What if you had an assistant that could review every conversation with a customer and provide you with summaries and overall themes?
Value of Data Slicer
Our Data Slicer tool is designed to provide you just that. In short, our platform employs AI to read your Live Chat and Call Transcripts to provide you with a map of your conversational data.
Specifically, the "session-level" Reasons analysis identifies the topic of each conversation, which are then grouped by Categories to surface high-level themes.
Navigation & Terminology
Here’s a short video to get you started.
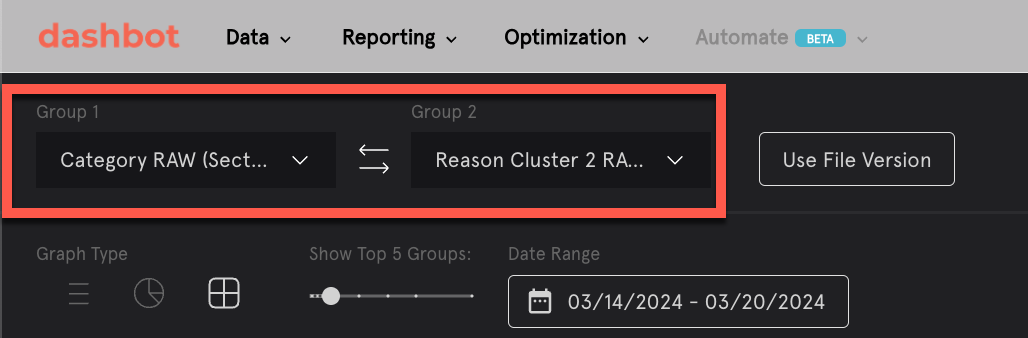
In summary—The analytics in Data Slicer are organized by dimensions of analysis. The list of available dimensions appear under Group 1 and Group 2.
- Some dimensions represent higher order groupings of the same analysis to show themes. For example, Reason -> Category -> Category Cluster.
- Values assigned to the "Reasons" and "Category" dimensions are dynamic, in that they come directly from the text and are not predefined—this is an ideal starting point but users may wish to create a defined list later.
- Lastly, dimensions may represent analysis run at the “Session-level” (i.e., analysis of the full transcript) or “Section-level” (i.e., analysis of smaller pieces of a transcript). We suggest using Session-level analysis to start.
Getting Started
A few configurations to get you into the data.
Reasons Analysis:
Q: What topics of conversation emerge across conversations?
A: Categories show the Reasons that users engaged in a conversation grouped by themes.
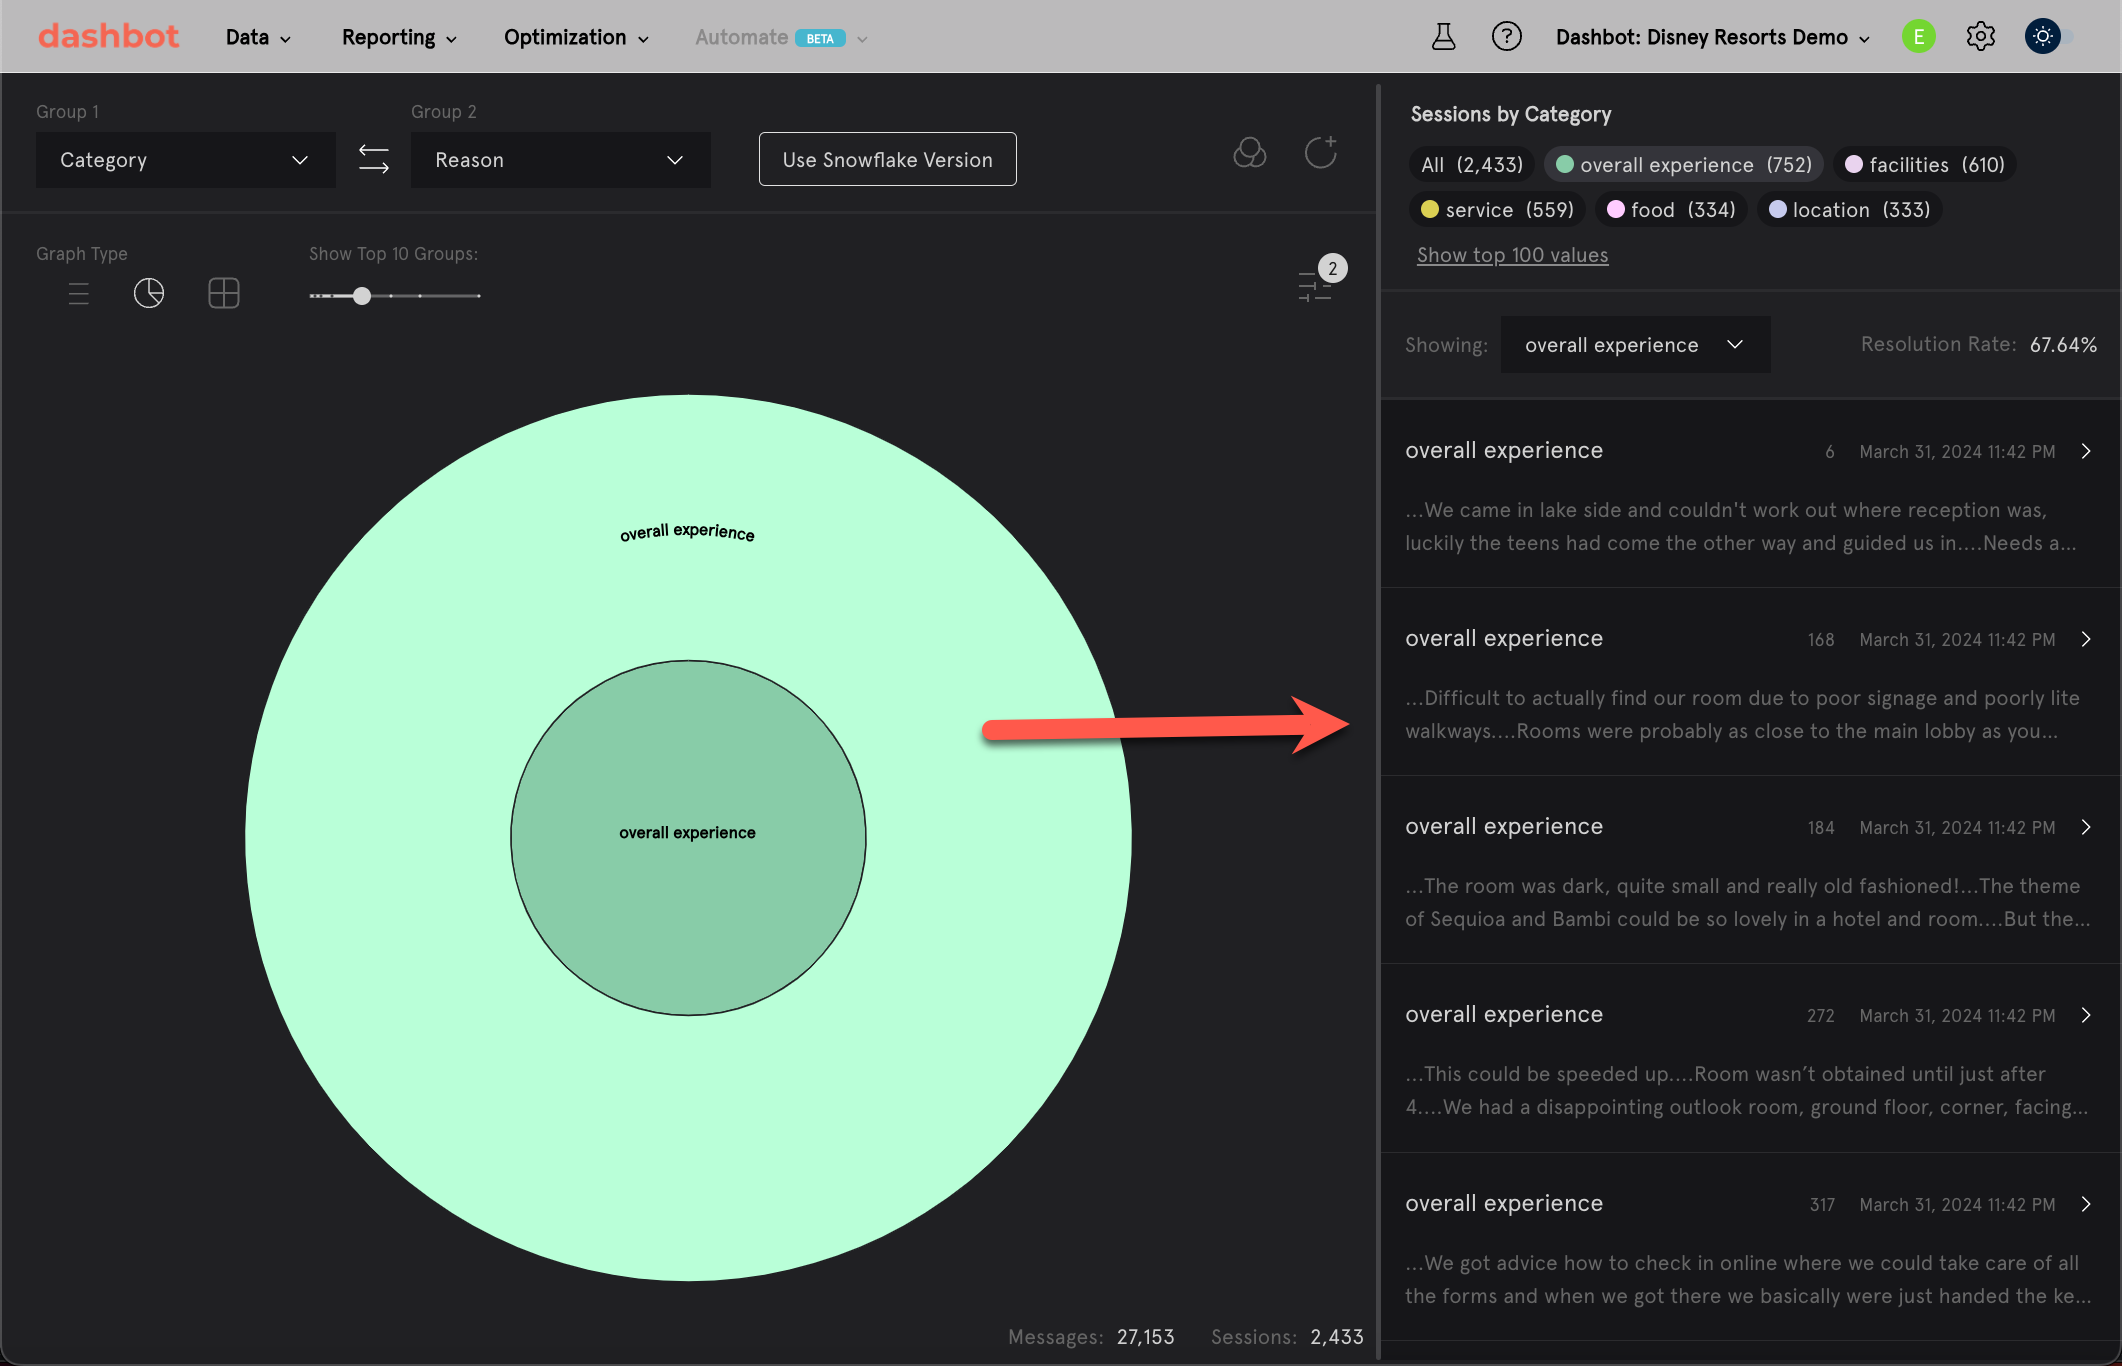
Starburst- Here we see the top Categories detected (inner) and subcategories or Reasons within them (outer)
- Try drilling down into a single category by clicking on it.
- Then switch the Graph Type to "list view" and move the group slider all the way to the right to “view all” Reasons within the selected category
- e.g., List - Career Development All Reasons
“Predicted Feedback” Analysis:
Q: How can I explore topics of conversation in more detail?
A: Using “Predicted Feedback” you can view summaries from the POV of user feedback.
- Treemap- Here we see the top Reasons within the “Career Advice” category.
- Try drilling down to “job search” (clicking on that tile adds this as a filter) and change to list view
- Then click on the double arrows between Group 1 and Group 2, and change the Group 2 dimension from “Category” to “Predicted Feedback”
- e.g., List Job Advice" All Feedback
Channel Analysis:
Q: How can I understand what's being said via different channels?
A: Using dimensions that contain metadata you can segment data by Live Chat vs. Calls
Starburst- Here we see the top Categories associated with Live Chat and Call Transcripts.
- Try drilling down into “call transcripts” and changing to list view
- Then click on the double arrows between Group 1 and Group 2, and change the Group 2 dimension from “Category” to “Session_Reason”
- e.g., List - “Call Transcript” Top Reasons
Configure Data Slicer Features
- Dimensions Selector: Choose which dimensions of analysis to view by selecting from the list of dimensions in Group 1 and Group 2
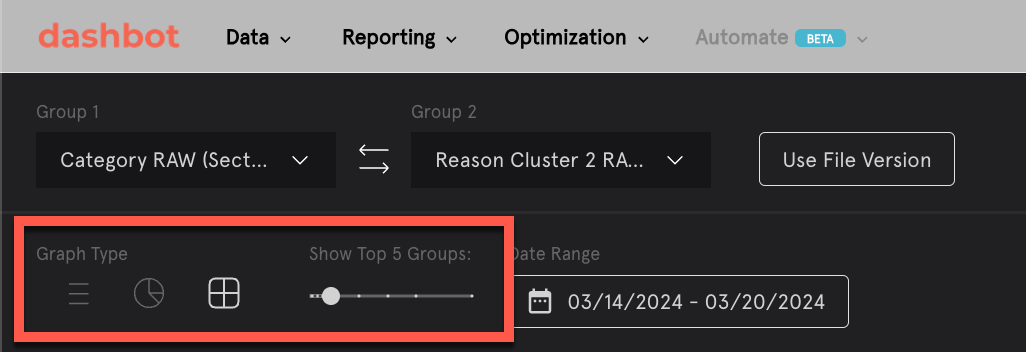
- Adjust Visualization Outputs: Choose the graph type and adjust the number
of values (1,2,3,5,10,15,20, or all) using the slider
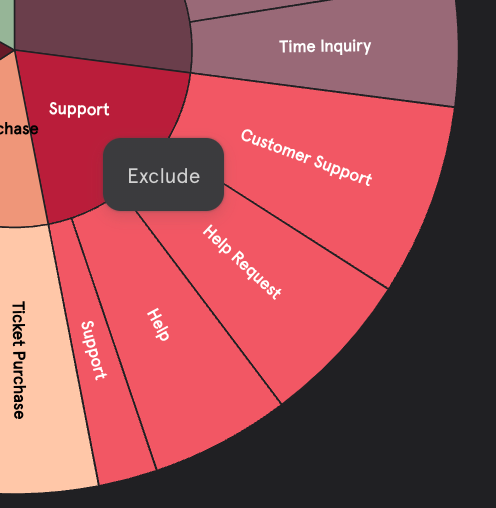
- Apply and Remove Values: Left-click on a value to apply an inclusion filter and zoom into that portion of the analysis. Right-click on a value in a visualization to remove it from the analysis with an exclusion filter
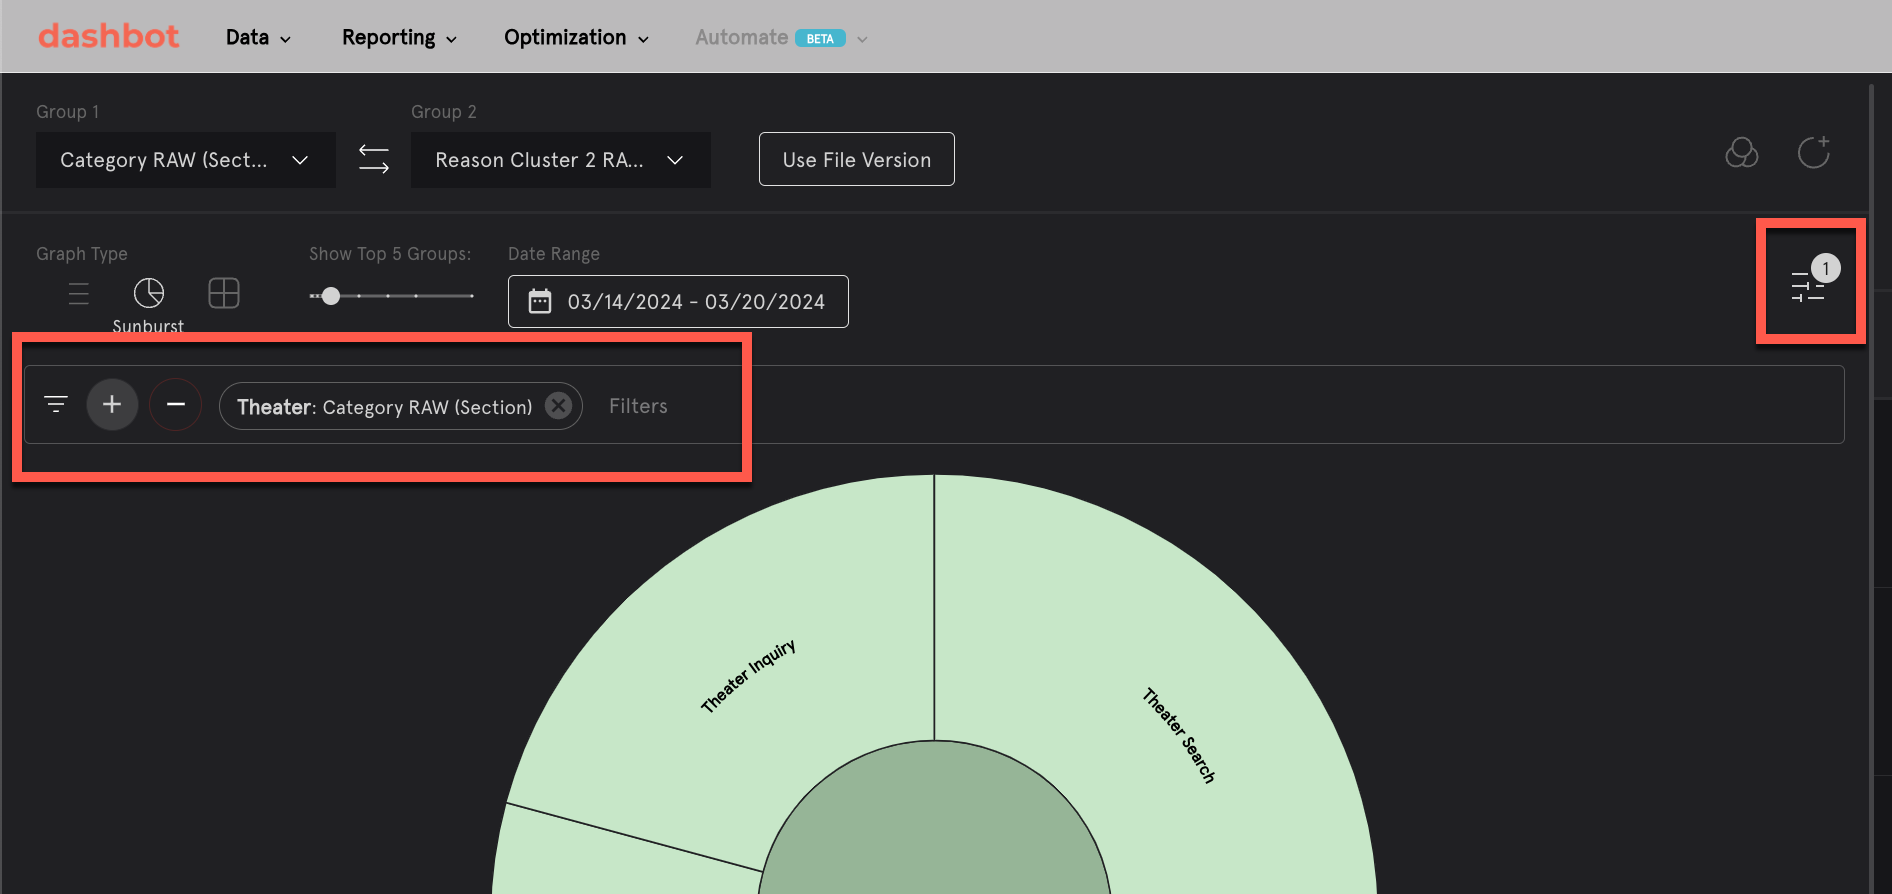
- Understand Applied Filters: View which filters are applied and make adjustments by clicking on the filter icon
- Drill into transcripts: Transcripts which appear in the right panel change based on the set of filters applied. Drill into a specific transcript to view all text associated with the message
Updated 4 months ago